Print Cost
Summary
Print-Cost started with something I did in college. I ran a small printing business. Pricing a document happened entirely in my head, by gut feel and quick mental math while a queue of customers waited.
The shop is closed now that I work full-time, but the problem stayed with me. This project is me going back to that old headache with machine learning instead of a calculator.
Three jobs at once
Running the shop meant doing three things at once:
- Serving customers who wanted documents printed
- Calculating printing prices page by page
- Selling office supplies (ATK) in between
A page is rarely just black or just color. Some pages are full color, some are mostly black, and some only carry small colored bits like a logo. During peak hours, getting the price right while the queue kept moving was stressful, and it was easy to get wrong.
Customers had their own complaint:
- They had no clear price estimate before coming to the shop
- The final cost could feel unpredictable
- Customers sometimes felt overcharged, even when I priced honestly.
On average, deciding the price category took about 1 second per page. That sounds small until you are holding a document with hundreds of pages.
Documents are data
That left me with one question:
“Why does printing cost still need to be calculated manually, when a document is essentially data?”
Everything else followed from it.
The goal was a system that could:
- Analyze each page of a document
- Measure ink usage
- Assign a fair and consistent price category
Faster was the easy part. Consistent and explainable was the point.
How the machine learned my gut feel
Turning pages into ink numbers
Each PDF page is converted into an image, then transformed from RGB into the CMYK color space. From there I calculated how much Cyan, Magenta, Yellow, and Black ink each page used.
Labeling 884 pages in an afternoon
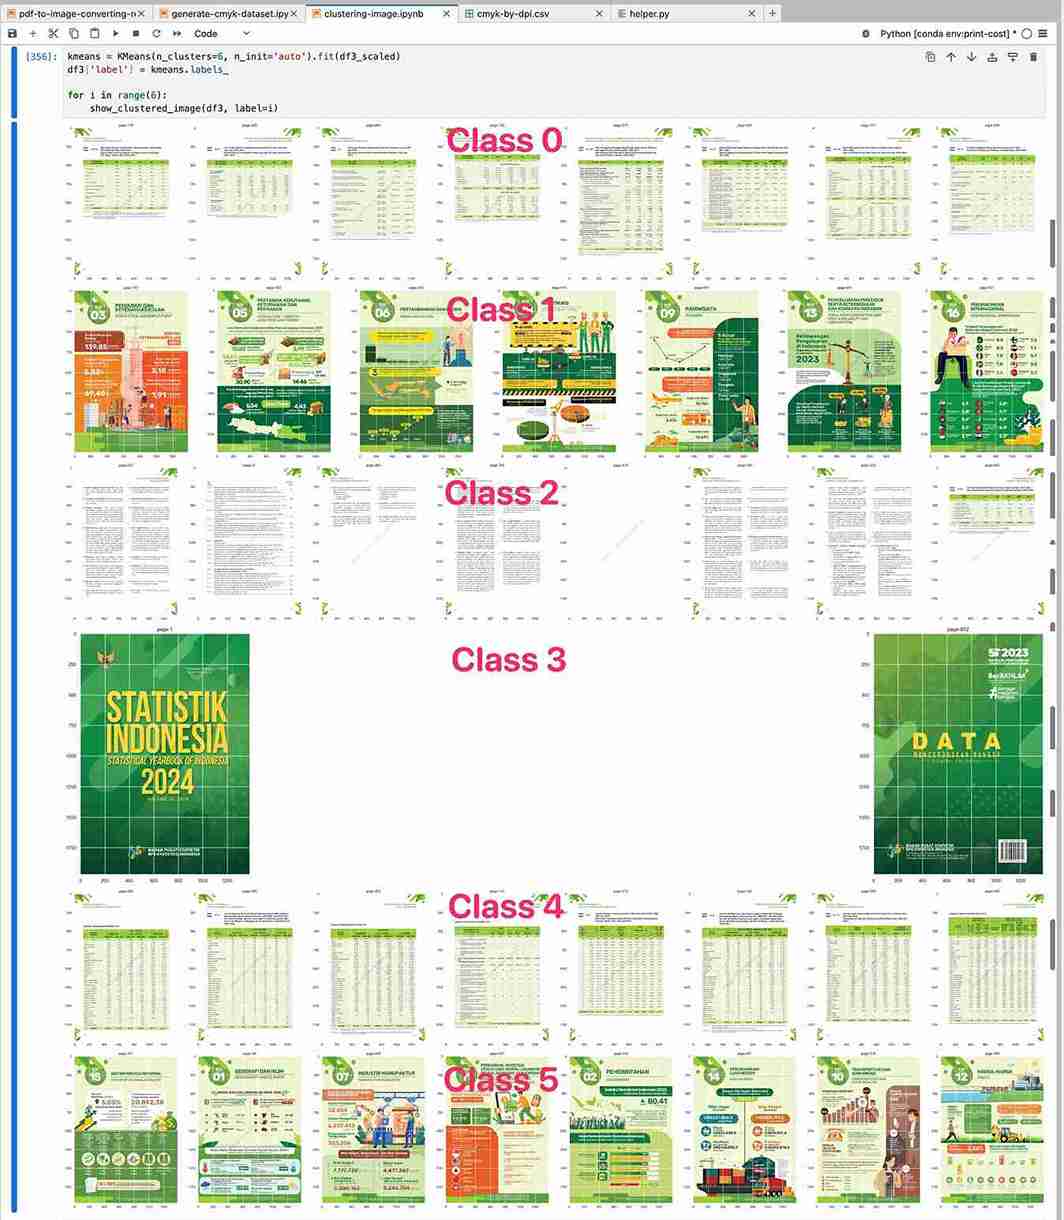
The initial dataset had no price labels, so I applied K-Means clustering to group 884 pages into 6 clusters based on color similarity.
I then mapped those clusters by hand into 5 pricing categories (Rp500 to Rp2000), which was 147× faster than labelling pages one by one.
Why 7 DPI won
With labels in place, I trained an XGBoost classifier. After trying a few quality settings, 7 DPI won: fast feature extraction with barely any change in model performance.
Architecture
graph TB
    subgraph Offline labeling - once
        P884[884 unlabeled pages] --> KM[K-Means 6 clusters]
        KM --> MAP[hand map to 5 price bands]
    end
    subgraph Online pricing - per upload
        PDF[User PDF upload] --> API[FastAPI calculate endpoint]
        API --> IMG[image processor PDF to CMYK ink]
        IMG --> XGB[XGBoost classifier via model manager]
        XGB --> CALC[cost calculator]
        CALC --> RES[summary + pie chart + tooltips]
    end
    MAP -. labels .-> XGB
What came out
The business that started this no longer operates, but the results held up:
- 🚀 109× faster than manual pricing (109 pages per second)
- ⏱️ An 884-page document can be priced in 8.13 seconds
- 🎯 99% F1 score, tuned the way a shop needs it:
- More tolerant of slight underpricing
- Actively avoiding overcharging customers
The model is only half of it. A price also has to make sense to the customer:
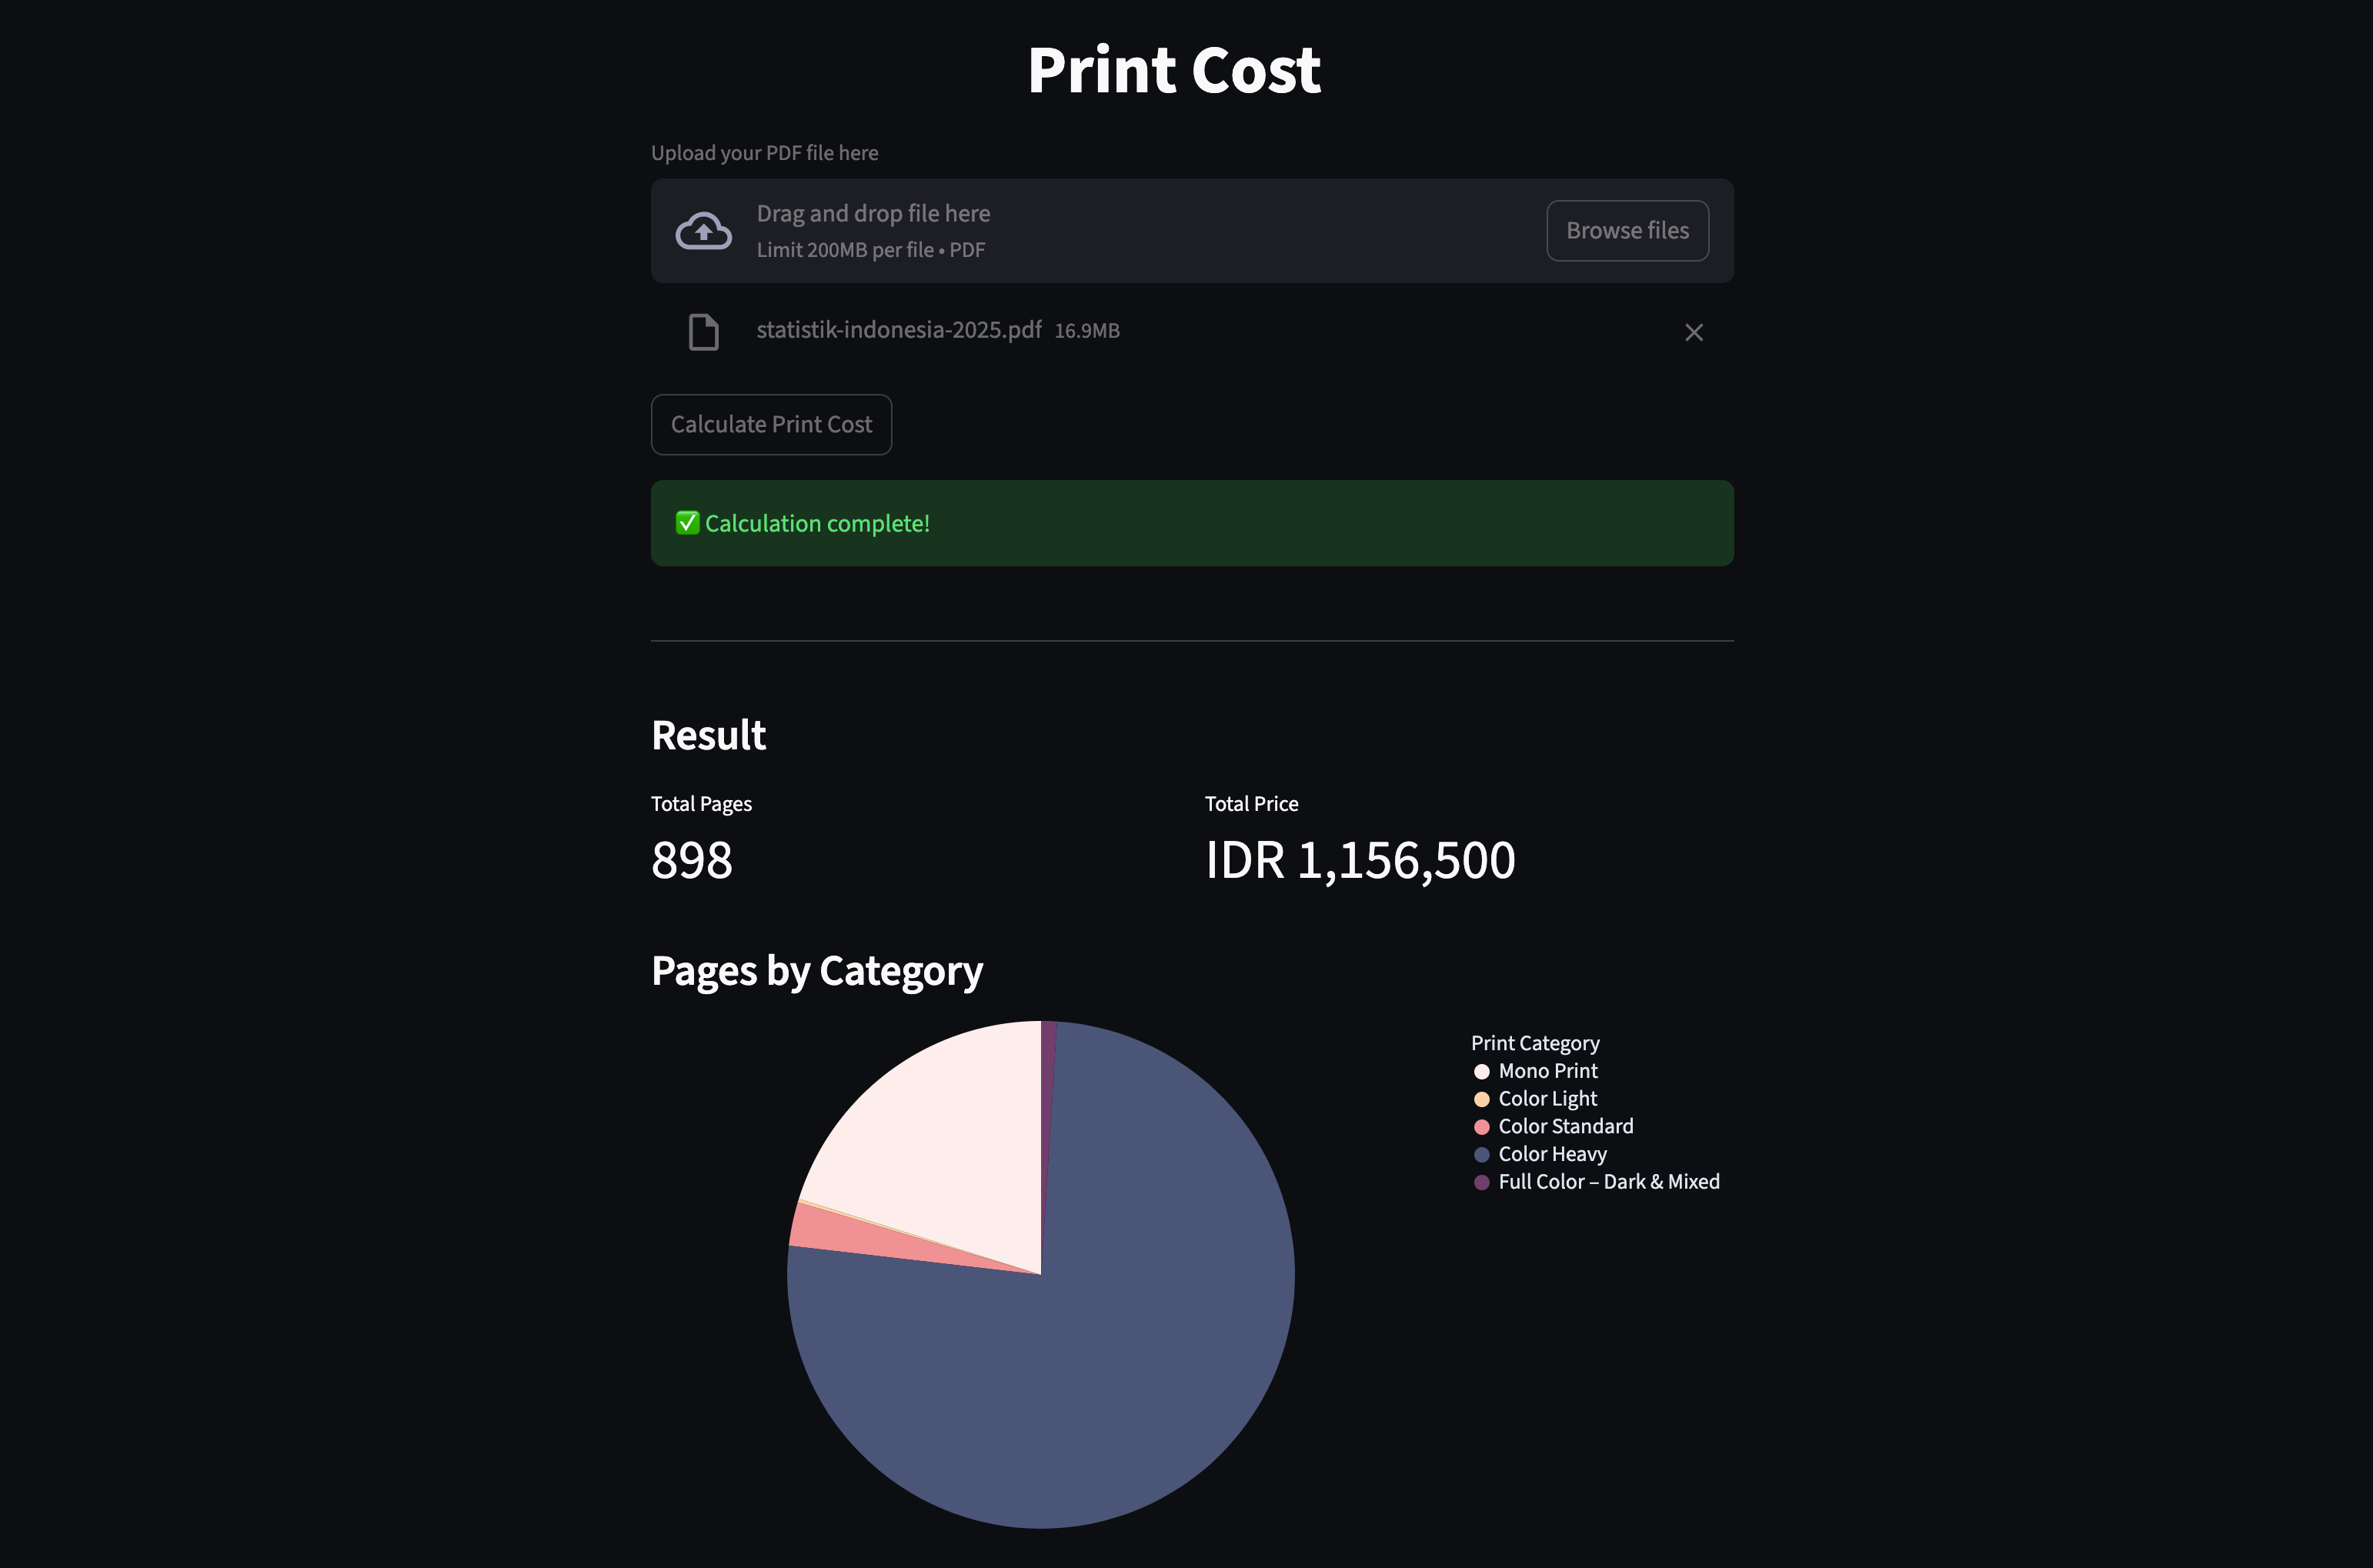
- 📄 A simple summary showing the total number of pages and the final price
- 🥧 A pie chart showing the price category distribution based on color intensity per page
- 🖱️ Interactive charts with tooltips, so a customer can see:
- How many pages fall into each price category
- Why certain documents cost more than others
With the charts, you can point at the pages that pushed the price up instead of asking the customer to take your word for it.
The original problem was tiny: how much does this stack of paper cost. That is the kind of thing data science is actually useful for.
Try It Yourself
If you want to try it, both the code and the live demo are open:


-
🔗 GitHub Repository:
https://github.com/rasyidev/print-cost -
🚀 Live Demo:
https://rasyidev-print-cost.hf.space
The repo holds the full pipeline; the demo runs the pricing and shows the charts.
What I still would not trust blindly
This one is personal. It is a problem I actually had, revisited a few years later with better tools.
The shop is gone, but the same problem sits in plenty of small print shops today. That is the part I find interesting.
I would want to test the classifier on documents from another shop before trusting the F1 score anywhere else. The 884 pages I had were my own, with my own mix of color and black text, and I have no idea how well they represent a print shop in another city.